


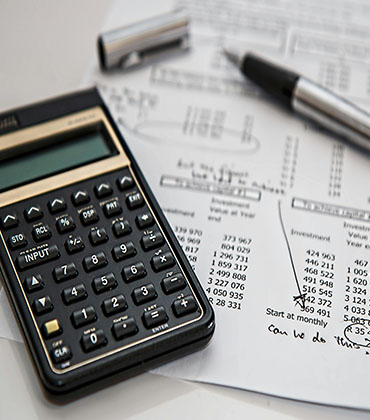

Deegits Technology Ltd built a unified Smart Dashboard platform that aggregates live data from across a business — sales, stock, payroll, operations, and customer activity — and presents it in a single, always-current view for management. The result is a genuine single source of truth that replaces the daily ritual of pulling reports from four different systems and reconciling them in a spreadsheet.
Business owners and managers were making decisions based on yesterday's numbers — or last week's, depending on when someone last exported a report. Finance data lived in one system, stock in another, sales in a third. Getting a complete picture required manual effort every time, and the delay meant that problems were spotted too late to act on quickly.
The solution needed to pull from multiple data sources in real time, present information clearly for non-technical users, and be accessible on any device — from the office desktop to a phone while travelling.
Management teams using the dashboard reported that their morning reporting process — previously 45–90 minutes of pulling and reconciling data — was eliminated entirely. Decisions that previously required a meeting to assemble the right numbers could now be made on the spot, with full confidence the data was current.
Automated alerts caught two significant stock issues and one cash-flow anomaly within the first month that would previously not have been noticed until the weekly review meeting.
Before we get started
Please provide your information so we can reply to you if you leave the chat.
UK audience focus. Chat transcript is saved for follow-up.
Control what we store. Essential cookies are always on.